


Table of Contents
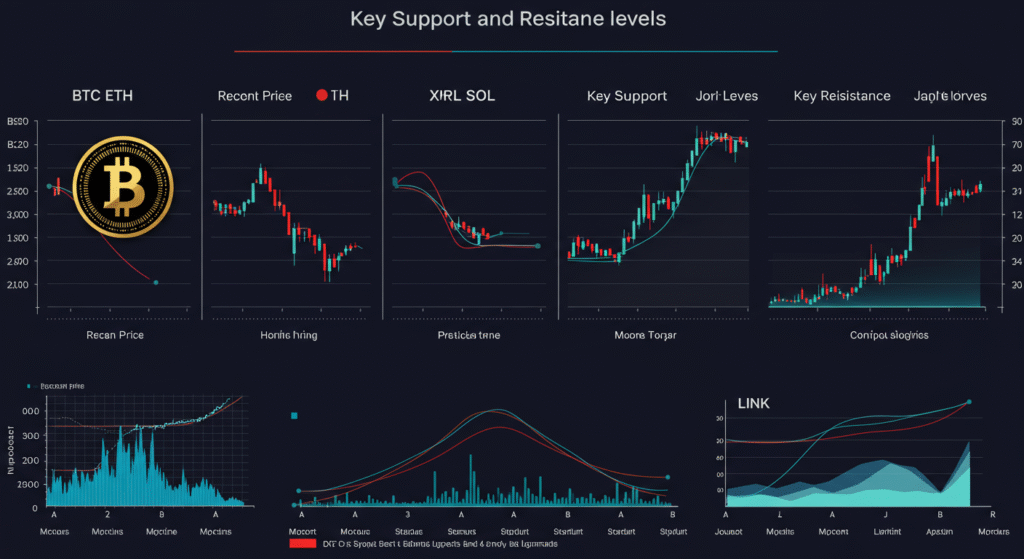
The cryptocurrency market is currently in a phase of high uncertainty, with Bitcoin sending new short-term signals and several major altcoins—including Solana, Chainlink, Ethereum, and XRP—hovering near crucial support levels. Despite the overall bullish sentiment from a long-term perspective, short-term indicators suggest caution, consolidation, and strategic positioning. In this post, we break down the latest technical analysis, trading setups, and what investors should watch for next.
Bitcoin: New Bullish Divergence Amid Momentum Loss
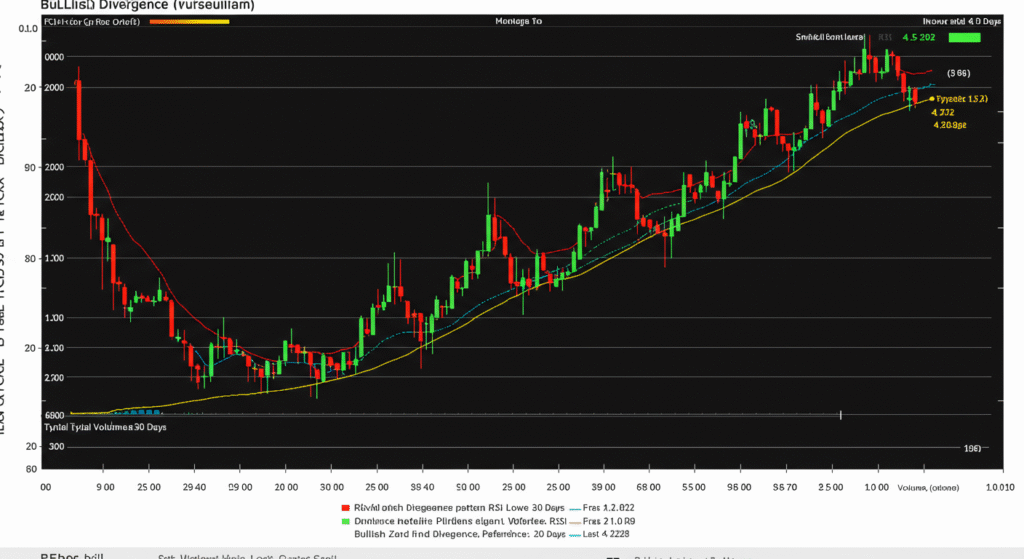
Bitcoin has recently flashed a bullish divergence on the 4-hour chart, which is an important signal to monitor in the short term. This divergence comes as prices formed lower lows while the RSI (Relative Strength Index) recorded higher lows—a classic indication of potential bullish relief or sideways movement.
However, this short-term optimism must be weighed against the weakening momentum on longer time frames:
- Weekly MACD is showing fading bullish momentum.
- A bearish divergence remains on the weekly timeframe.
- Support range: $101,000–$102,000
- Resistance range: $110,000–$112,000
So far, the trend remains bullish overall, but the slowdown could lead to either consolidation or a minor correction in the coming weeks.
What’s Next for Bitcoin?
Unless Bitcoin breaks below the $101K–$102K support zone with a confirmed daily candle close, the bull trend remains intact. A break below this level, however, would shift sentiment and likely initiate a larger corrective move.
In the immediate term, traders can expect:
- Slight bullish relief
- Sideways price action
- High potential for fake-outs

Ethereum: Stuck in Sideways Zone with Neutral Bias
Ethereum (ETH) is also trapped in a choppy sideways trend, ranging between $2.4K and $2.8K. Although the trend is still technically bullish, ETH lacks momentum and continues to consolidate.
Key levels:
- Support zones: $2.4K and $2.5K
- Resistance zone: $2.7K–$2.8K
- A bearish divergence is still active, suggesting weakness
Ethereum Outlook
The price action is boring for long-term holders and accumulators, but traders can still profit within the range. If ETH breaks below $2.4K, expect a shift to bearish sentiment. Until then, the price will likely bounce between established support and resistance.
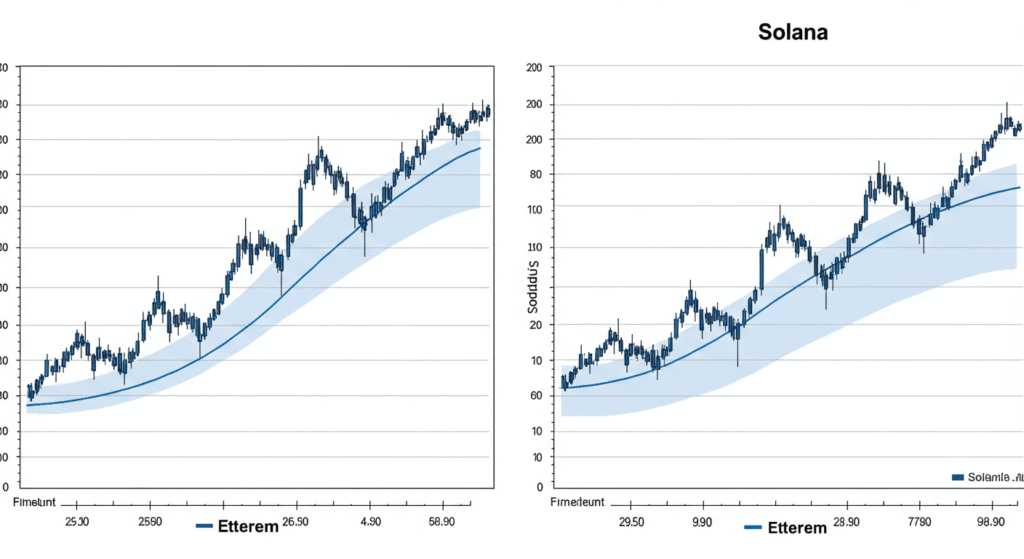
Solana: Danger Zone Approaching
Solana (SOL) is trading dangerously close to a critical support zone between $143–$146. This range has previously triggered multiple rebounds, but any confirmed break below this support, especially under $143, could lead to a steep drop toward $124–$125.
Solana: Critical Levels to Watch
- Support: $143–$146 (immediate), $124–$125 (next)
- Resistance: $154–$156 (minor), $167 (major)
The key indicator here is whether Solana can defend the $143 level. A breakdown would signal a major shift to bearish momentum and a change in price structure.
XRP: Flat and Frustrating, But Profitable for Traders
XRP is experiencing a classic sideways price range, bouncing between $1.25–$2.10 on the support side and $2.30–$2.35 on the resistance side.
Despite this lack of direction, experienced traders can profit from this choppiness by entering long near support and exiting near resistance.
XRP Summary
- Short-term sentiment: Neutral
- Support: $1.25–$2.10
- Resistance: $2.30–$2.35
XRP’s price is flat, and there’s no clear momentum to either side. But in these conditions, disciplined range trading is the optimal strategy.
Chainlink: Testing Support With Bullish Divergence
Chainlink (LINK) is another altcoin closely approaching key support at $12.80. The daily chart reveals price structure testing this level, but importantly, the 4-hour chart shows a bullish divergence, just like Bitcoin.
Chainlink Key Price Zones
- Immediate support: $12.80
- Secondary support: $12.10–$12.20
- Breakdown level: Below $12 could see a drop to $10–$11
- Resistance: $13.60, $14.10–$14.20, and strong resistance near $15.50
As long as LINK stays above $12.80, there is a high chance of minor relief or sideways movement. If it breaks below, however, the bearish move could intensify.
Bitcoin Heatmap: Liquidity Grab Possible
Bitcoin’s liquidation heat map shows a concentration of liquidity around $103,000, meaning it’s a likely short-term dip target. Traders should stay alert for a brief dip to this level followed by a rebound—especially if support holds between $103.5K–$104K.
This aligns with the short-term bullish divergence and supports the theory of a temporary bullish relief rally or sideways chop rather than a significant dump.
Consolidation Phase = Opportunity
Many traders get bored or exit the markets during periods of sideways consolidation, but these phases present prime opportunities for range trading. Knowing your support and resistance zones allows for:
- Easy profits on short-term swings
- Avoiding emotional trades during fakeouts
- Planning strategic entries before the next big move
Current Strategy and Trading Setup
According to the presenter’s strategy:
- He remains in a swing long position on Bitcoin, with no changes in the last 24 hours.
- His stop-loss remains in profit, and he has not added or taken profit during this sideways period.
- He only plans to turn bearish if Bitcoin closes a daily candle below $101K.
Tools for Trading
For those looking to trade during this period:
- Tubbit Exchange: Offers no KYC, global access, and up to $50,000 in bonuses for traders.
- Bitex Exchange: Another top alternative with bonuses of up to $45,000 and $200 deposit bonus on $1,000.
These platforms offer features that suit both swing traders and high-volume day traders. Be sure to check local regulations before trading.
Final Thoughts: Stay Strategic During the Slow Grind
Although the crypto market isn’t moving dramatically right now, the current slow grind phase is part of every macro cycle. Smart investors know that sideways price action builds the foundation for the next big breakout—either upward or downward.
Here’s what you can do right now:
- Monitor support zones for Bitcoin, ETH, SOL, LINK, and XRP
- Look for bullish or bearish confirmation candles
- Avoid emotional trades based on small pumps or dumps
- Use range-trading strategies in sideways conditions
Remember, the real profits are made not when the market moves fast, but when you’re patient and positioned before the move.